 Apr 05, 2026 - 0
Minutes read
Apr 05, 2026 - 0
Minutes read
How to Use Trading View for Fundamental Analysis (Quick Guide 2026)
Analyze Financial Data, Valuation Metrics, and Market Trends Easily
Trading View is widely known for chart analysis, but it is also a powerful platform for fundamental analysis. By using its built-in financial tools, investors can evaluate a company’s performance and make smarter decisions.
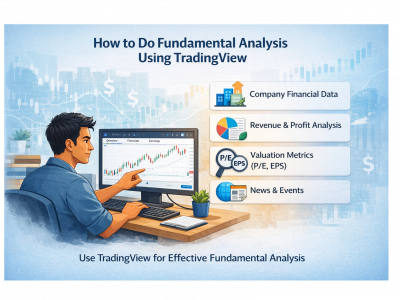
The first step is to open any stock on Trading View and go to the Financials section. Here you can analyze important data such as revenue, net income, and profit margins. Consistent growth in these numbers usually indicates a strong company.
Next, focus on valuation metrics like P/E ratio and EPS. The P/E ratio helps determine whether a stock is overvalued or undervalued, while EPS shows how much profit a company earns per share. Comparing these metrics with similar companies gives better insight into market value.
Another key feature is earnings analysis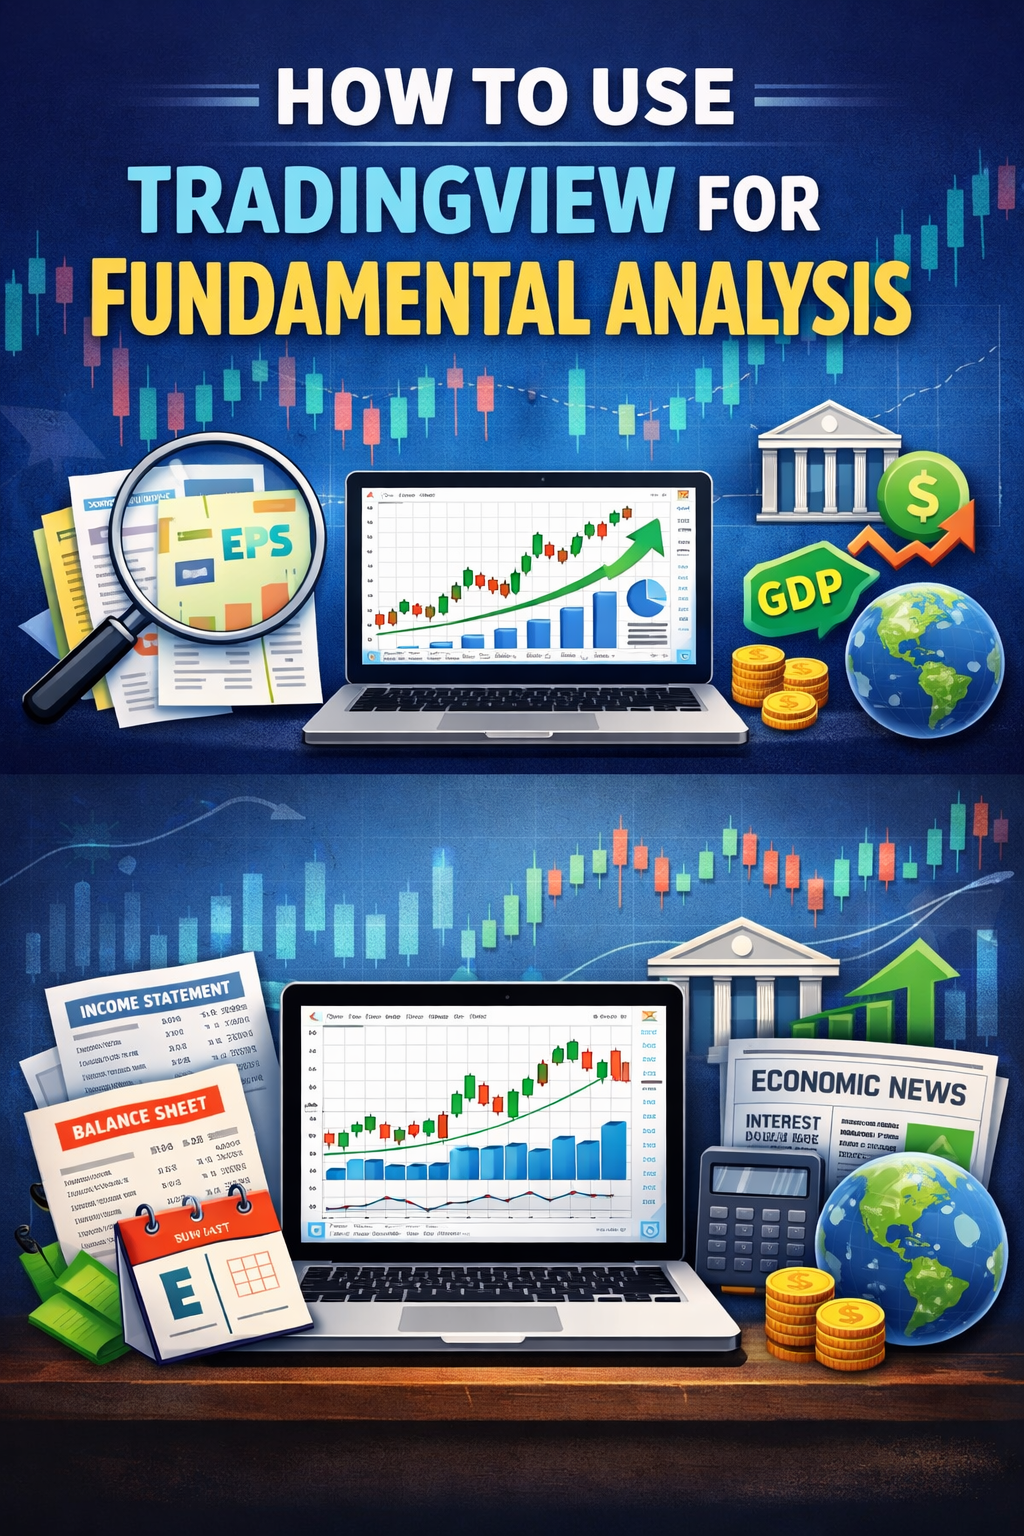
You should also use the News and Events section. Market news, economic updates, and company announcements can quickly affect stock performance. Combining financial data with real-time news helps create a complete analysis.
For better results, traders often combine fundamental analysis with technical analysis. Fundamentals help identify strong companies, while charts help find the best entry and exit points.
In conclusion, Trading View is not just a charting tool—it is a complete solution for analyzing stocks. By using financial data, valuation metrics, and market news, you can make more informed investment decisions.