 Apr 02, 2026 - 0
Minutes read
Apr 02, 2026 - 0
Minutes read
Top 10 Best Indicators on TradingView for Better Trading (2026)
Master RSI, MACD, Moving Averages, and More to Improve Your Trading Strategy in 2026
Introduction
Choosing the right indicators is one of the most important steps in becoming a successful trader. With so many tools available, beginners often feel confused about which indicators to use. This guide on best TradingView indicators will help you understand the most powerful tools and how to use them effectively.
If you want to explore charts and indicators directly, you can start using the TradingView official platform to practice in real-time.
Top 10 Best Indicators on TradingView
1. RSI (Relative Strength Index)
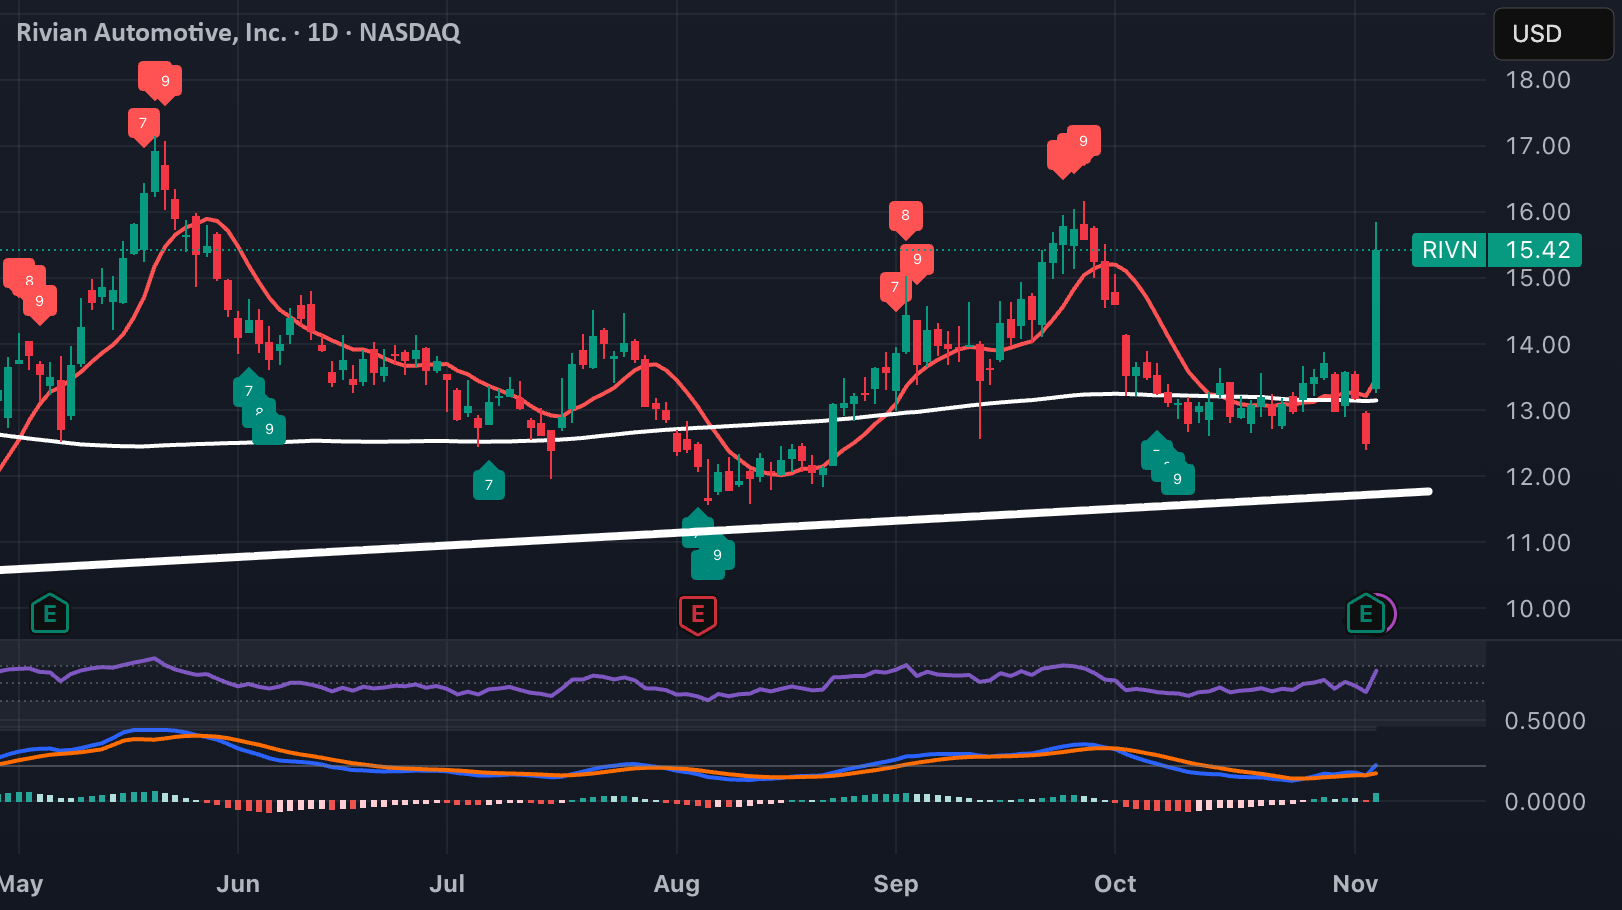
RSI is a momentum indicator that measures whether a market is overbought or oversold. When RSI is above 70, it may indicate overbought conditions, and below 30 suggests oversold levels. It helps traders spot potential reversals.
2. MACD (Moving Average Convergence Divergence)
MACD is used to identify trend direction and momentum. A bullish signal occurs when the MACD line crosses above the signal line, while a bearish signal appears when it crosses below.
3. Moving Averages (SMA & EMA)
Moving averages are essential for identifying trends. Traders often use EMA for faster signals and SMA for smoother long-term trends. Crossovers are commonly used as entry signals.
4. Bollinger Bands
This indicator helps measure market volatility. When price touches the upper band, the market may be overbought, and when it touches the lower band, it may be oversold.
5. Volume Indicators
Volume confirms the strength of a trend. High volume supports strong price movement, while low volume may indicate weak trends.
6. Fibonacci Retracement
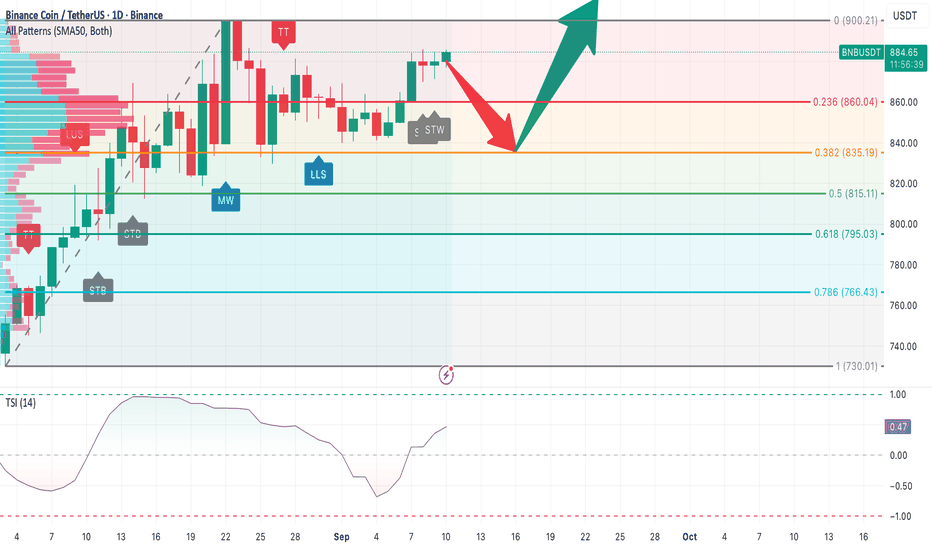
Fibonacci levels help identify potential support and resistance zones. Traders use it to find entry points during pullbacks.
7. Stochastic Oscillator
This indicator compares closing price to price range and helps identify overbought and oversold conditions.
8. VWAP (Volume Weighted Average Price)
VWAP is mainly used in intraday trading. It shows the average price weighted by volume and helps identify fair value.
9. Ichimoku Cloud
A powerful all-in-one indicator that shows trend, momentum, and support/resistance levels in one view.
10. Custom Indicators (Pine Script)
TradingView allows users to create custom indicators using Pine Script. You can also use community-built indicators to enhance your strategy.
How to Use These Indicators Effectively
Using one indicator alone is not enough. Professional traders combine multiple indicators for confirmation. For example, you can use RSI with Moving Averages or MACD with volume analysis to improve accuracy. Always focus on understanding price action along with indicators.