 Apr 02, 2026 - 0
Minutes read
Apr 02, 2026 - 0
Minutes read
Trading View Chart Analysis Guide: Master Technical Analysis (2026)
Learn Candlestick Charts, Support & Resistance, Trend Analysis, and Chart Patterns for Smarter Trading
Introduction
Understanding chart analysis is one of the most important skills in trading. Whether you are trading forex, crypto, or stocks, learning how to read charts can help you make better decisions. This TradingView chart analysis guide will teach you the fundamentals of technical analysis, including chart types, support and resistance, trends, and chart patterns.
To practice real-time chart analysis, you can explore the TradingView official platform and apply these strategies directly.
Types of Charts (Candlestick, Line, Bar)
TradingView offers different chart types, but the most popular one is the candlestick chart. Candlesticks show open, close, high, and low prices, making them very useful for understanding market behavior.
Line charts are simpler and show only closing prices, which helps beginners identify trends easily. Bar charts are similar to candlesticks but slightly more complex to read.
Among these, candlestick charts are the most widely used in technical analysis trading because they provide more detailed market information.
Support and Resistance
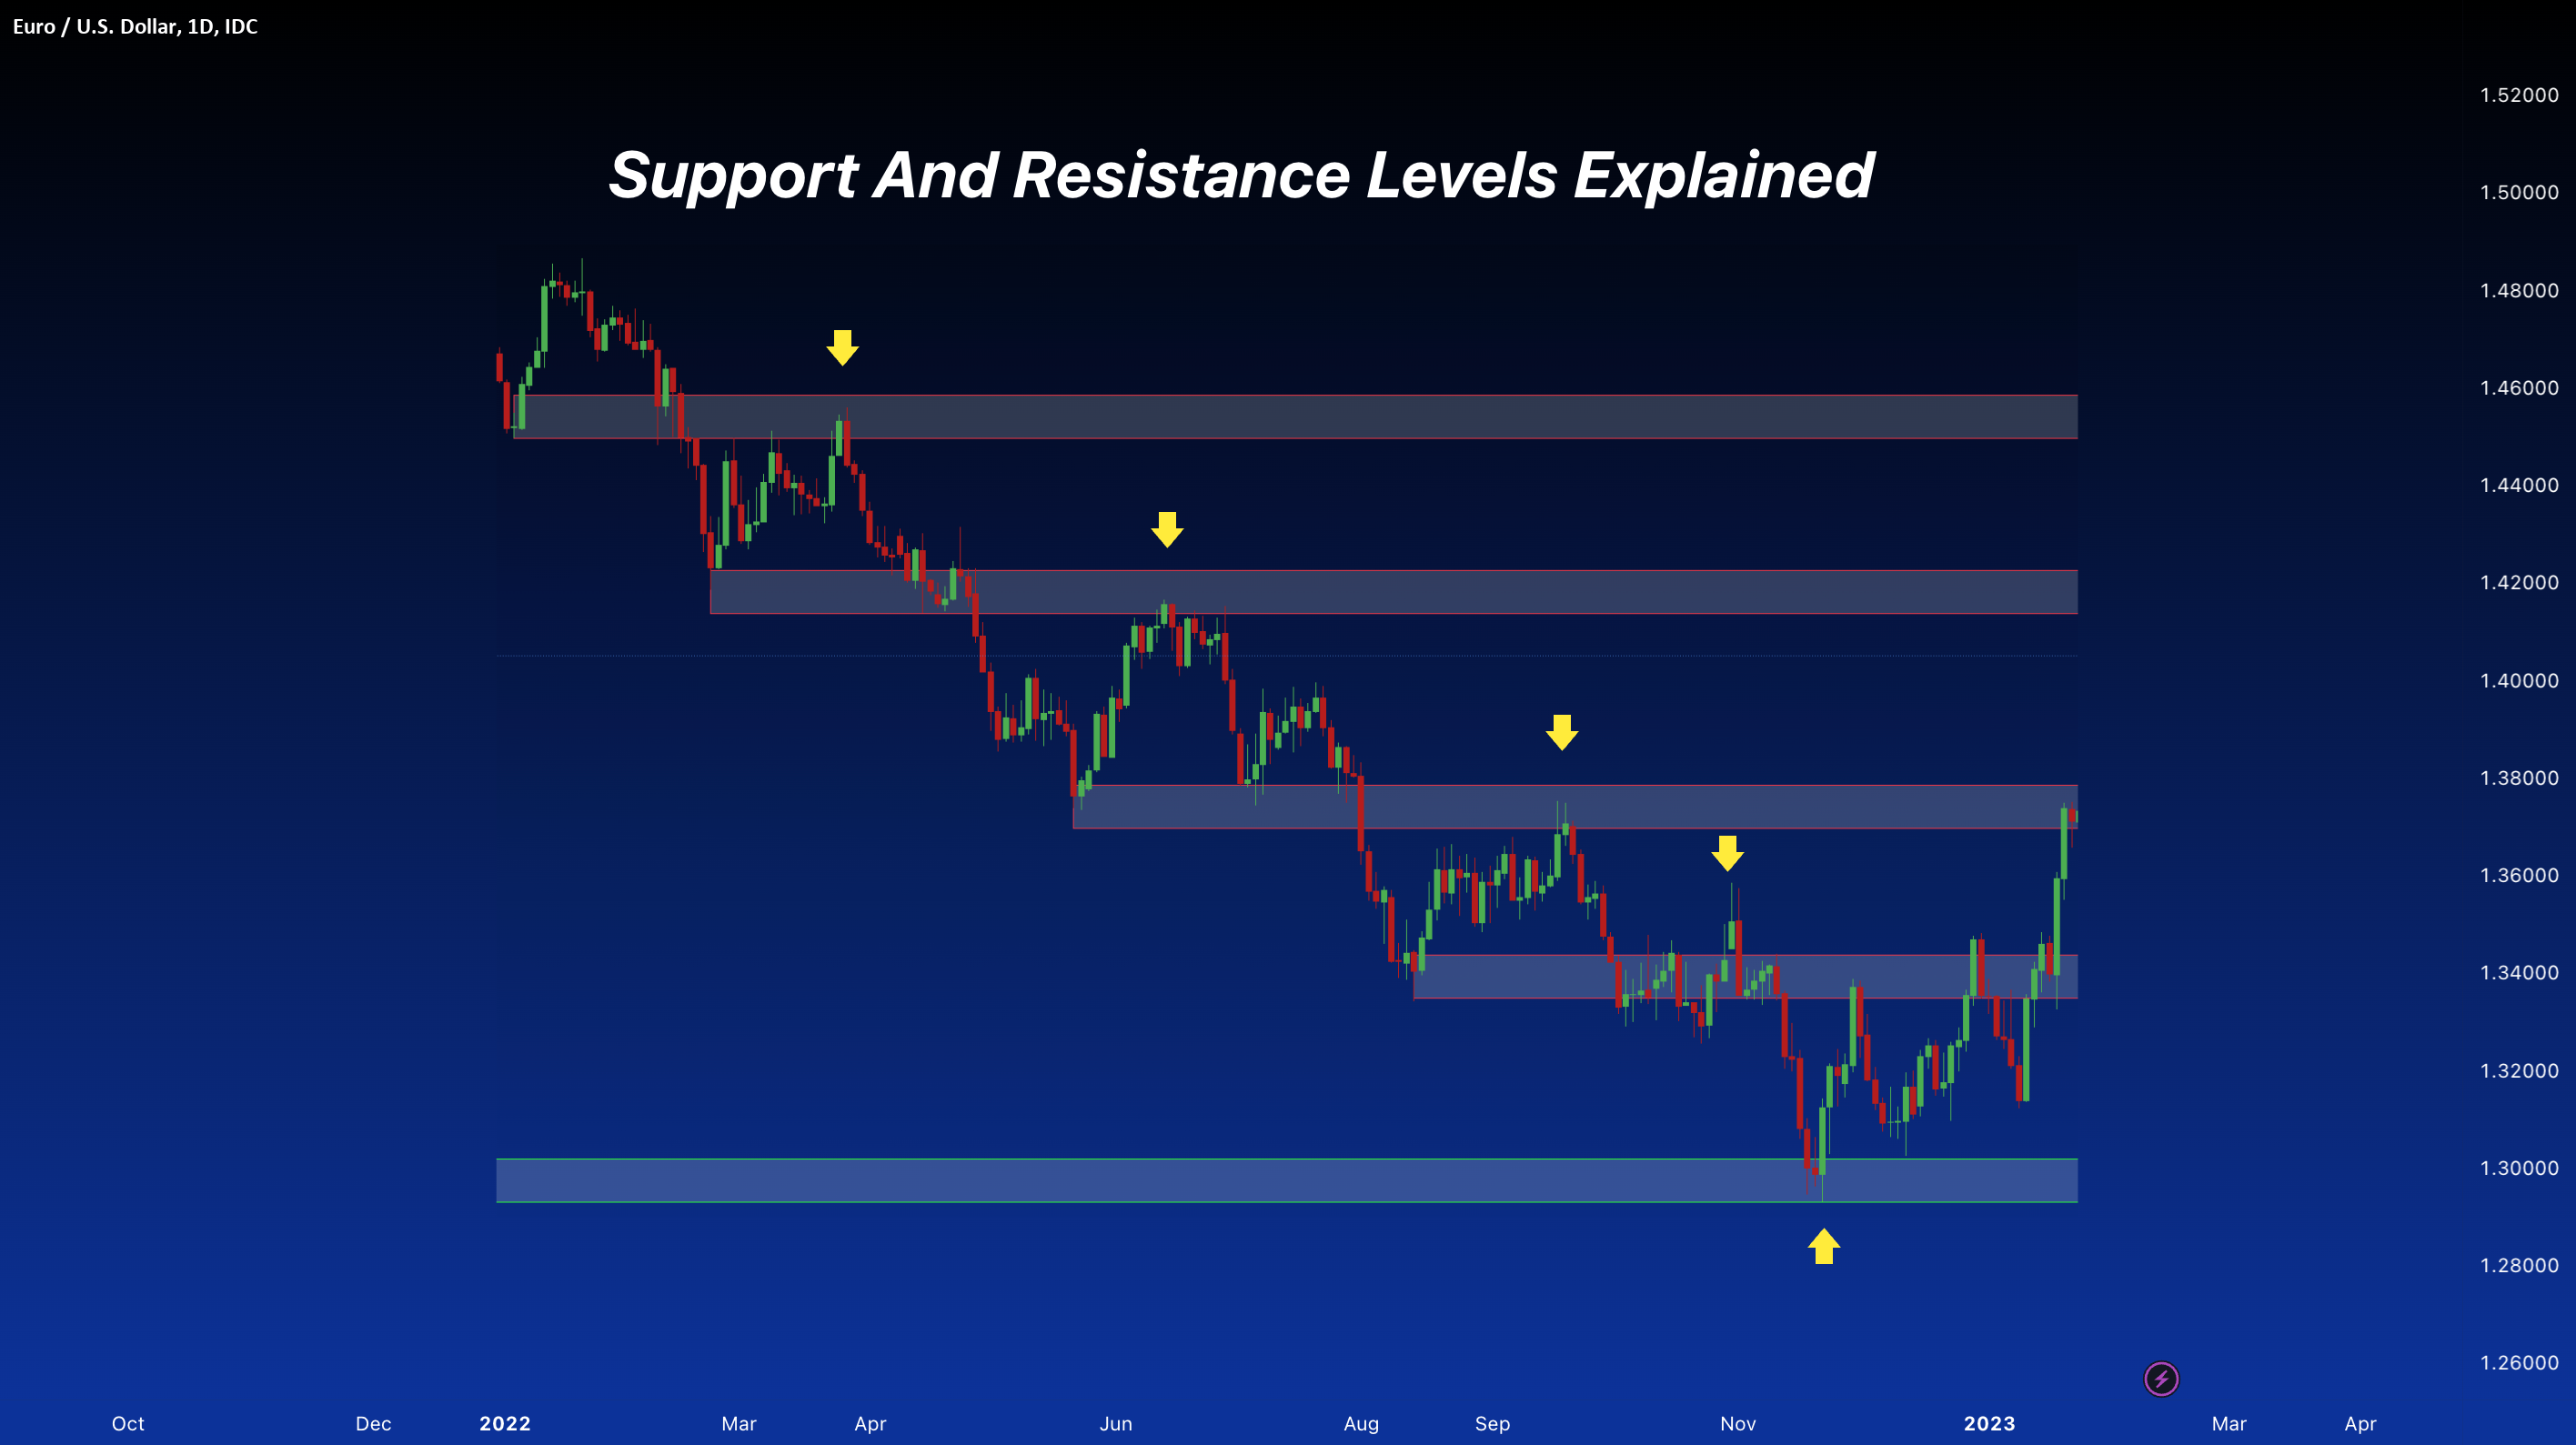
Support and resistance are key concepts in chart analysis. Support is a price level where the market tends to stop falling, while resistance is where the price often stops rising.
Traders use these levels to identify entry and exit points. When the price breaks a resistance level, it may continue upward. Similarly, when support breaks, the price may move downward.
Understanding support and resistance trading helps traders make more accurate decisions.
Trend Analysis
Trend analysis helps traders identify the overall direction of the market. There are three types of trends:
- Uptrend (higher highs, higher lows)
- Downtrend (lower highs, lower lows)
- Sideways trend (range-bound market)
Using trendlines and moving averages, traders can confirm the trend direction. Trading with the trend is one of the most effective strategies in price action trading.
Chart Patterns
Chart patterns help predict future price movements based on historical behavior. Some common patterns include:
- Head and Shoulders
- Double Top & Double Bottom
- Triangle Patterns
- Flags and Pennants
These patterns are widely used in trading chart pattern strategies and can help identify potential breakout or reversal points.
How to Improve Your Chart Reading Skills
To master chart analysis, you need consistent practice. Start with basic concepts like support and resistance, then move to trend analysis and patterns. Avoid using too many indicators and focus on price action first.
Professional traders often combine multiple strategies for confirmation rather than relying on a single signal.